

Insights
What is a metric in Google Analytics worthy paying close attention to?
19/07/2023
43
What is Google Analytics?
Google Analytics (GA) is a free web analytics tool from Google that measures website metrics. GA works to provide users with all information from basic to detailed. So what is a metric in Google Analytics and what information does it tell you about your website?
Generally, the data collected from Google Analytics will showcase the general performance of your website on the biggest search engine in the world. Specifically, it ranges from how well it attracts users, how users find their way to the website, and whether it does a great job retaining these users.
- Website traffic
- Time spent by users on the website, on each page, exit time, and bounce rate
- Sources, countries, browsers, and devices of user access
- Pages on the website that users have clicked on
- Pages that users frequently visit on the website
- Keywords used to search for the website.

Learn about Google Analytics
One special feature of GA is that it is compatible with all other tools in Google’s toolkit. This means that you can integrate Google Analytics with other platforms such as Google Adwords, Blogger, Youtube,….
4 Stages of Google Analytics Operation
Google Analytics operates in four stages, which you need to understand to fully utilize the tool.
Raw data collection
Google Analytics collects data on the website through pre-installed JavaScript code. Simply put, all user cookies containing demographic and device-related information are collected by Google Analytics through JavaScript code. Then, they are transferred to Google’s server.
Conversion of raw data into secondary data
From the data collected in the previous stage, at Google’s server, the data is converted from raw to secondary data. This is the data that can be exported into reports for easy understanding.
Selecting the metrics to track
Through the View property of GA, you can choose the type of metrics you want to track most frequently.
Generating reports
Generating reports is the final stage in a cycle of Google Analytics operation. It fully includes statistics related to all website activities.

Google Analytics supports detailed website reporting
Highlighted features of Google Analytics
Understanding the features of Google Analytics will assist you in conducting an in-depth analysis of your website. Google Analytics has six standout features:
Dashboard setup
The Dashboard is a collection of widgets that allow you to monitor important reports and metrics related to your website. GA also provides features that allow you to create various types of dashboards, depending on your analytical purposes.
For example, you can create a dashboard for mobile performance or to track real-time website performance. However, Google Analytics does not have pre-built dashboard templates for you to choose from. You must build your own dashboard for your specific purpose.
Understanding user language and device usage
Google Analytics can provide information on users accessing your website in different languages. In addition, the tool also shows the platform they are using, such as mobile devices or PCs.
With this information, you can choose the appropriate content strategy to reach the maximum potential customers, especially optimizing your website.
Learning about user habits
One of the great features of Google Analytics is accurately providing user behavior on the website. It can collect data on the average real-time time users spend on the website per visit, which posts are read the most, the average time on each page, and the bounce rate.

Google Analytics helps you to understand the behavior and habits of users on your website
Collecting and analyzing demographic data
The metrics analyzed by GA includes gender, interests, geographic location, etc. Collecting this vast amount of information is made possible thanks to Google’s server location or user-cookies.
Specifying information for specific days
This function allows you to create specific information annotations for each day. You can add a note by going to any report, clicking the arrow-down button at the bottom of the report.
Checking traffic sources
The traffic sources that GA collects and reports to website administrators include:
- Organic Search: Natural traffic from users actively searching on Google.
- Referral: Backlinks
- Social: Social networks, popular ones being Facebook, YouTube, Twitter,…
- Direct: Obtained when users directly enter the website address in the URL bar.
- Additionally, there are other traffic sources such as Email, Paid Search (in case you use Google Ads),…

Knowing traffic sources through Google Analytics
What is a metric in Google Analytics?
The metrics in Google Analytics help website administrators easily measure and check the status of their website.
Session – Number of user sessions
A session is the number of interactions a user has when accessing and interacting with a website. It should be noted that a user can have multiple sessions, meaning they have returned to the website multiple times.
A session is counted from the moment a user accesses the website until they close the tab and do not make any other visits to the website.
Within a session, a user can interact with various pages on the website. Such activities can be navigating to other pages on the website, viewing products, zooming in on images, copying text, etc.
Alternatively, if a user accesses the website, does not interact, and exits the website without returning within 30 minutes, it is also counted as one session.
What about when a user accesses the website, does not interact, and exits the website immediately? This is a single-page session, with a duration of 0.
User – Number of users
This metric allows website administrators to understand the number of users accessing the website during a specified period of time. To view this metric, you need to select the “Audience” section and click on “Overview.” The screen will then display the “Users” box.

Go to the user section to see the number of visitors
Pageview – Number of page views
The number of page views will show you how many pages users have viewed, calculated within a session. Pageviews are counted from the moment a user accesses the website, including cases where they do not interact or exit the page.
Bounce Rate
This is the ratio of users accessing the website and then exit without any actions to the number of sessions. The higher the bounce rate, the more it indicates that your website content is not optimized well for users. The higher this rate, the lower Google will evaluate your website.
Avg. Time Per Session – Average time spent on the page
This is the amount of time a user spends on a website. The longer a user stays on a page, the more useful the content on that page is.
Avg. Pageviews Per Session – Number of pages per session
This metric tells you the average number of pages a user views in a session. Depending on the nature of each website, the number of pages per session can be evaluated differently.
For example, a website selling household items usually has a higher number of pages per session than a company introduction website or landing page.
Conversion Rate
The website conversion rate is the ratio of users who visit the website and perform a desired action to the total number of users. Some common purposes include:
- Visiting the website and filling out a form, providing information.
- Accessing the website and making a purchase.

GA can collect conversion rate data
Google Analytics User Guide
After learning about the features of Google Analytics, On Digitals will share with you how to use this tool.
Creating an account
After you have a Google account, you can log in directly or use your linked Google Ads account at http://www.google.com.vn/analytics.
If you do not have an account, click “Sign in” at the top of the page and select “Analytics”. In case you are already logged in, you will be taken directly to the Google Analytics dashboard.
If you have not set up Google Analytics, follow the setup instructions after clicking on “Set up” and “Start measuring”.

Interface after logging in to Google Analytics
The next step is setting up the account. This includes the Account Setup (GA account name), Property Setup (property, time zone, region, and currency unit).
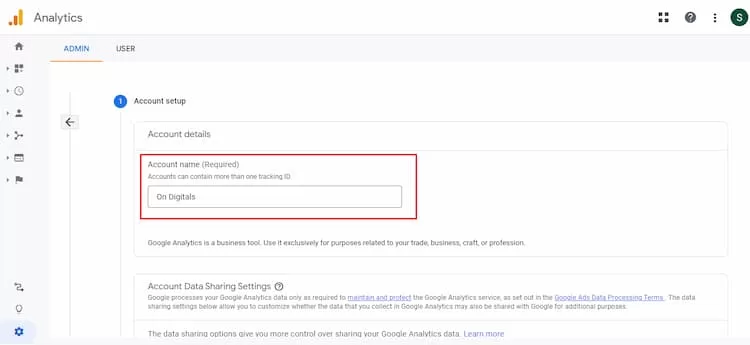
Set up Account section in Google Analytics
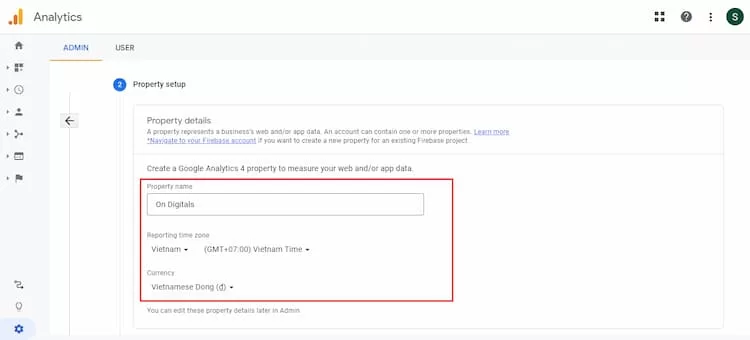
Set up the Property section in Google Analytics
Next, fill in your business information and click “Create”.

Set up business information in Google Analytics
Next, when the interface displays the Google Analytics registration agreement, click “I Accept”. After completing these steps, you have successfully created a new Google Analytics account to start analyzing and optimizing your website.
Note that Google Analytics often uses a hierarchical structure to organize your accounts. From one Google account, you can make up to 100 different Google Analytics accounts.
How many websites can you use the same Google Analytics account for?
Google Analytics allows you to set up to 50 website properties for the same account. On top of that, you can set up 25 views for one website property. With multiple GA accounts, some situations may arise:
- If you only have 1 website: You only need one GA account with one website property.
- If you have 2 websites: For example, one website for your business and one website for your personal brand. You can create 2 GA accounts named “Business” and “Own”. Then, set up your business website in the “Business” account and your personal website in the “Own” account.
- If you have 3-49 businesses, each with its own website: You can place all of these websites in one Google Analytics account, which can be named “Business”. Then, set up a separate Google Analytics account for your personal website and name it “Own” to distinguish them.
- If you have multiple businesses and each business has many different websites (≥ 50 websites): You should set up separate accounts for each business, for example, Business 1, Business 2, and so on.

Google Analytics supports up to 50 properties on the same website
Depending on the scale of your business and how you organize your websites, you can choose one of the four options above. You can also change the name of your Google Analytics account and its properties. However, remember you cannot move a property (website) from one Google Analytics account to another.
Install tracking code
After completing the account setup as instructed above, click on “Get Tracking ID”. A popup will appear with the terms and conditions of Google Analytics. Click to accept these terms and conditions to receive the Google Analytics tracking code.

Install tracking code in Google Analytics
You will need to set up tracking code for each page of your website. The method of installation depends on the specific type of website you have. If you are using WordPress on your domain, you can use the Yoast plugin for GA tracking code installation. This method is simpler, even if you are using any WordPress theme or framework.
If your website is built with HTML files, you can add the tracking code before the </head> tag. You can use text editors like TextEdit on Macbook or Notepad on Windows. Then, upload the file to your web server using FTP clients like FileZilla.
Note that if you have an e-commerce store on Shopify, you will need to go to the Online Store settings and paste the tracking code in the designated area.
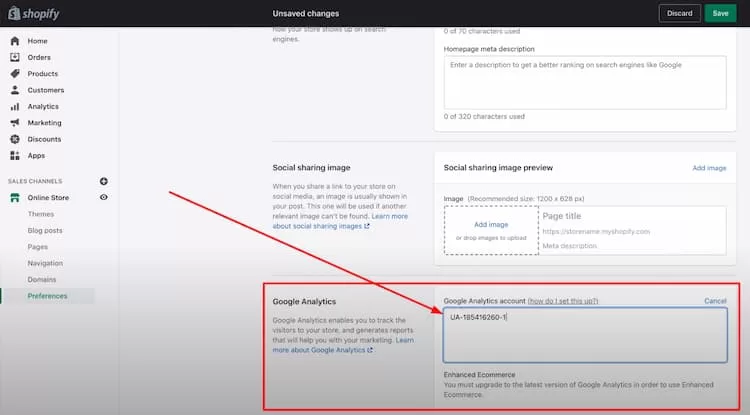
Paste the tracking code in the specified place on Shopify
If you have a blog on Tumblr, you can access it and click on “Edit Theme”. This button is located at the top right. Next, enter your Google Analytics ID in the settings.
In summary, setting up Google Analytics depends on the platform you are using. This includes content management systems, website builders, e-commerce software, etc. Additionally, it also depends on the theme and plugins you are using.
Determine the target
Setting up goals for your website is an important step. Click on the “Admin” section at the top of the Google Analytics page. Then, click on “Goals” under the “View” column.
Setting goals for your website is an important step
Setting up goals for your website is an important step. Click on the “Admin” section at the top of the Google Analytics page. Then, click on “Goals” under the “View” column.
Next, click on “New Goal” to create a target. Here, choose from a variety of customization options or skip this step if your website has already applied one. Then, click “Next Step”.
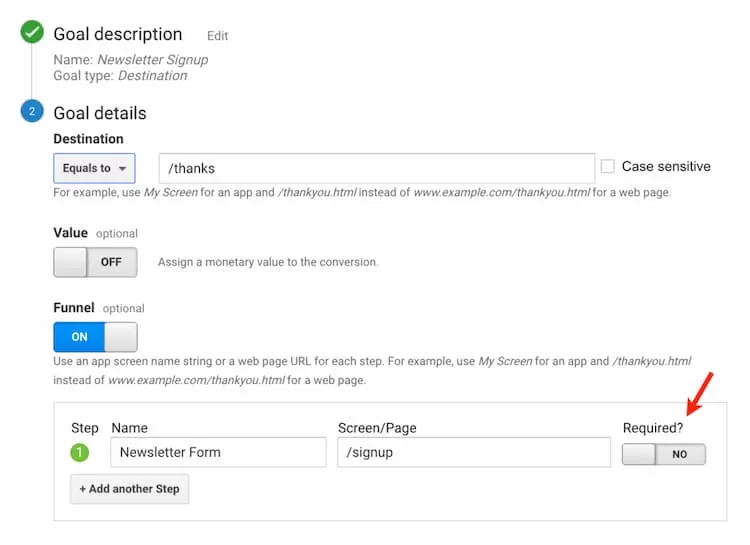
Choosing the right goal for your website is essential
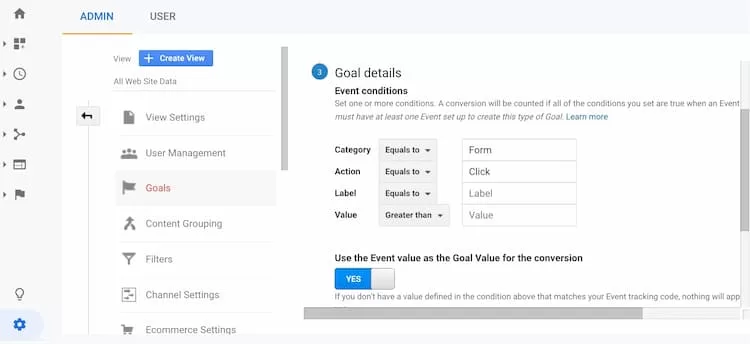
From here, you can name your goal and select “Destination”. Enter the URL of your thank you or confirmation page, located after the .com part of your website in the “Destination” field. In the drop-down list on the left-hand side of the “Destination” field, select “Begins with”.
Click “OFF” for the “value” field and enter a specific value to convert (if any). Finally, click “Save” to complete the setup.
If you want to track similar goals or conversions on your website, you can repeat the process. Currently, GA allows a maximum of 20 goals for a website.
Also, keep in mind that the goals you create are of real importance to the business. It includes submitting a form to a prospect, subscribing to an Email list, completing a purchase order.

Set goals that are important to your business
The Goals section will notify Google Analytics every time something important has happened on the website.
Create a search page
You can perform a site search for websites that have a search box. The search box helps users easily query the information they need on your website.
The steps to create a search page are as follows:
First, run a search on the website. Keep this tab open to see its URL.
Next, go back to the Admin menu in your Google Analytics account. In the View column, click on View Settings.

Click on View Settings to set up the page search
Next, scroll down to the Site Search Settings section and turn it on. Now, you can look back at the URL in the search results. Enter the query parameter (usually s or q) and click Save.
Performing this search page creation step helps Google Analytics track any search that customers perform on the website. As a result, you have additional information about what customers are searching for on each specific page.
Adding a new account and additional features
If you want to add a new GA account, go back to Admin, then click on the “Create Account” button.
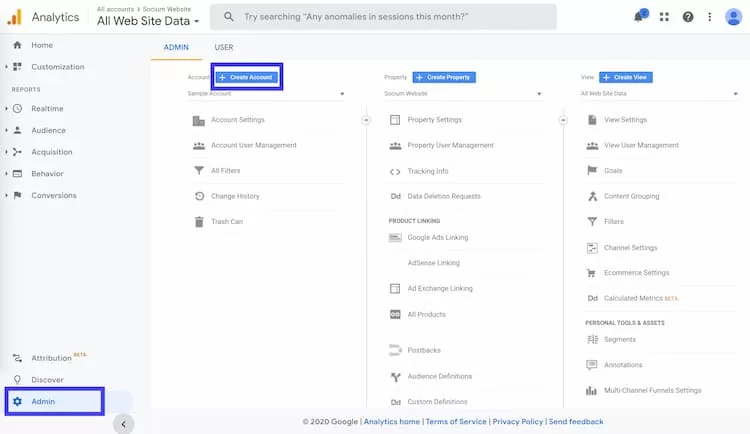
Adding a new account on GA is a simple process
Furthermore, if you want to add a new website to your GA account, go to the Admin menu, click on Create Property, and then follow the steps outlined above.
After setting up Google Analytics on one or more websites, creating new goals and a search page, you need to wait for 24 hours. During this time, GA will begin to collect and review data.
Viewing Data
After receiving data in GA, start exploring the traffic to your website by logging into your account. You can view the report in the Audience Overview section.
Additionally, if you have multiple websites, choose one to view the report. This is the first report among over 50 reports available in GA. You can also access other reports by clicking on the Reporting link at the top of the page.
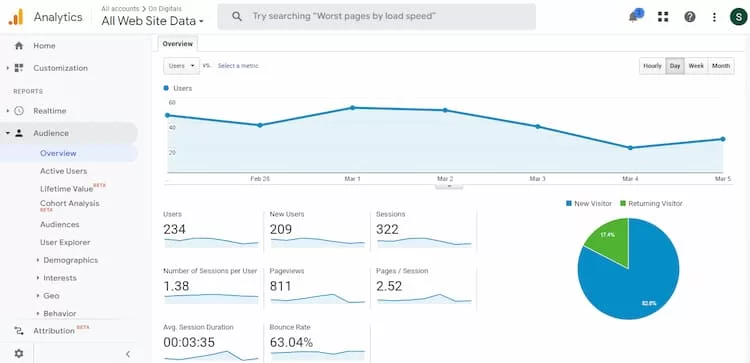
Viewing the Audience Overview report on Google Analytics
Standard reporting features
At the top left, click on the dropdown arrow next to the website to switch to other websites in your Google Analytics account. Additionally, you can click on the Home button at the top.
In the report at the top right, click on Day to change the date range. You can also check the Compare box if you want to compare your data within different date ranges.

It is easy to select a time period to view reports with GA
You can easily hover your cursor over various areas in GA’s report to learn more. Additionally, GA provides detailed reports on the top 10 languages, countries, cities, operating systems, browsers, service providers, and screen resolutions of users accessing the website.

Example of a report on the top 10 language metrics
You can also click on the Report link on each section to view the full reports. Or click on any link in the top 10 links to see more details.
Shortcuts and Emails
When you want to access a particular section multiple times, use the Shortcut link at the top of the report. You can add them to the Shortcut section in the left sidebar for faster access in the future.
Additionally, use the Email button to automatically send emails to yourself and other authorized team members who regularly view reports. If you choose to send an email to someone outside of the company, make sure they regularly check their email.
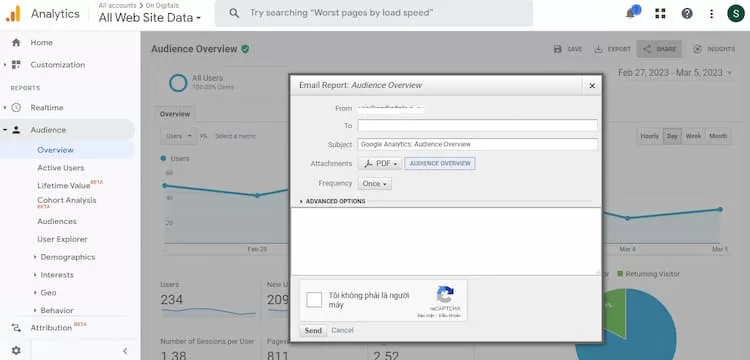
Google Analytics’ automatic email sends to one or more recipients
To view who is receiving data in Google Analytics, go back to the Admin menu, then click on the Scheduled Emails box in the View column.
Conversion
As you set goals in Google Analytics, you can easily view the number of conversions your website has received. It also lets you view the path users took to complete the conversion (in the Goals > Reverse Goal Path section).
Almost all tables in the standard GA report automatically link specific data to your conversions. Here are some examples to help you understand this:
- To view the number of conversions performed by customers who accessed from California, go to Audience > Geo > Location report.
- To view the number of conversions from customers accessing your website from Facebook, go to Acquisitions > All Traffic > Source/Medium.
- To view the number of conversions performed by customers from specific web pages, go to Behavior > Site Content > Landing Pages report.
If you have multiple goals, you can use the drop-down list at the top of the page to select the sections you want to view.
Types of Google Analytics Reports
There are many GA reports and each section is a specific report or a collection of reports.

Types of reports in Google Analytics
Audience Reports
This type of report provides information about website visitors, specifically:
- Demographics: referring to age, gender.
- Interests: common interests of the customer group.
- Geo > Location: address, language of the user.
- Behavior: frequency of website visits.
- Technology and Mobile: devices that users use to access the website.
Acquisition Reports
With the Acquisition Report, you will get the following data:
- All Traffic: provides information about what has driven visitors to your website.
- All Traffic > Channels: traffic divided by main categories.
- All Traffic > Source/Medium: specific traffic sources.
- Social: traffic from social networks.
- Google Ads: connect with GA to learn about PPC campaign information.
- Search Console: connect with GA to obtain data on search traffic in SEO.
Behavior Reports
The Behavior Report also provides a variety of data that is useful for analyzing and improving websites.
- Site Content > All Pages: top pages on your website.
- Site Content > Landing Pages: list of pages where users start their browsing sessions on the website the most.
- Site Content > Exit Pages: list of the last pages that users viewed and exited in a visit the most.
- Site Search > Search Terms: phrases that users often search for.
- Site Search > Pages: web pages displayed after users perform searches.
- Site Speed: website loading speed.
- Site Speed > Speed Suggestions: specific suggestions from Google to increase website loading speed.
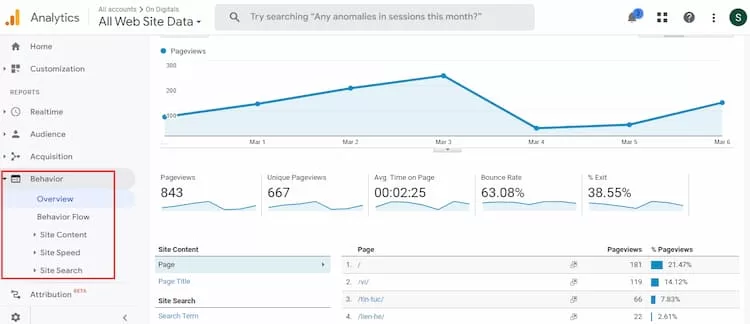
Behavior report interface
Real-time Reporting
Real-time reporting in GA shows you the number of people currently accessing your website, their location, traffic source, etc. All of this data is updated continuously at the time you are viewing the report.
To access real-time reporting in Google Analytics, select the account you want to view by clicking on the dropdown arrow at the top left corner. Then, navigate to the Report section and click on Real Time.
The GA real-time reporting includes 6 sections as follows:
- Overview report: The number of users, pageviews, and the duration (in minutes) the users have been active on your website.
- Location report: Location of the users accessing your website, including country, province/city,…
- Traffic source report: Traffic source that brought customers to your website, such as Google, social media, direct link access.
- Content report: Which content the users are currently viewing and how they arrived at that content.
- Event report: Events that have just occurred in real-time.
- Conversion report: The 20 recently completed goals in the user’s session, the number of users, and the conversion rate as a percentage of the total users.
Setting up Google Analytics 4
Google Tag Manager (GTM) and Google Analytics are two different tools, but they are linked and work together to track and analyze websites.
Using Google Tag Manager allows you to quickly track and update tags on your website or app from the website interface. So how do you set up Google Analytics 4 using Google Tag Manager?
Step 1: Set up an account on Google Tag Manager
First, log in to your Gmail account and click on “Create Account.”

Creating a new account on Google Tag Manager is the first step when installing GA4
Next, fill in the required information and click on Create. The interface will display the terms of Google Tag Manager. Read through and click “I also accept” to agree to the terms. To continue, click “Yes.”
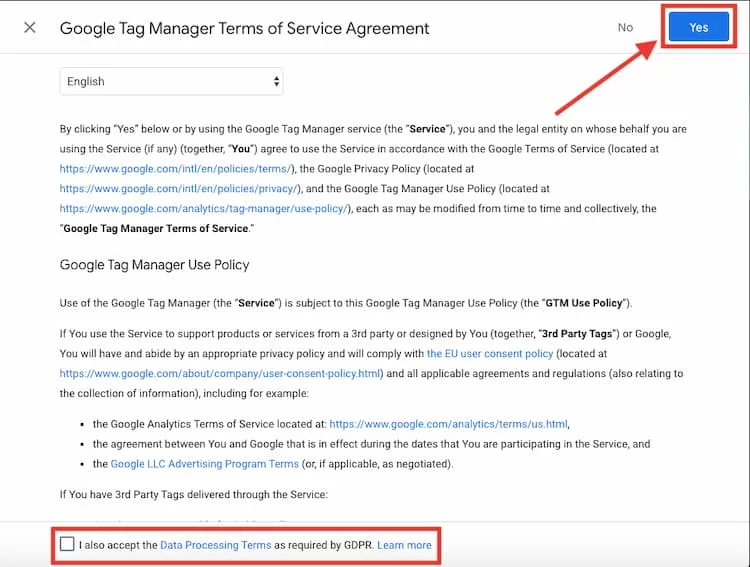
Agree to Google’s terms to register your account
Step 2: Obtain the Tracking ID
Since GA4 is integrated into Google Tag Manager, you no longer need to directly embed Analytics code into your website. After setting up, simply paste the tracking ID into GTM.
To do this, go to the admin menu in GA4. Click on “Tracking info” and copy the tracking ID code that is available in Google Analytics.
Step 3: Access the GTM – Variables tab
Next, access GTM and select Variables. Then, click on New to create a new variable.
Step 4: Create a new variable in Google Tag Manager
In this step, select Google Analytics Settings. Next, copy the tracking ID code from step 2 and paste it into the tracking ID field in GTM. Then, name the variable and save it.
Step 5: Access Tags in Google Tag Manager
In the Tags section, click on New to create a new tag for the variable you just created.

Create a new tag for the variable in Google Tag Manager
Step 6: Select Google Analytics: Universal Analytics
When a dialog box appears, click on Tag Configuration. This tag is located at the top and select Google Analytics: Universal Analytics.
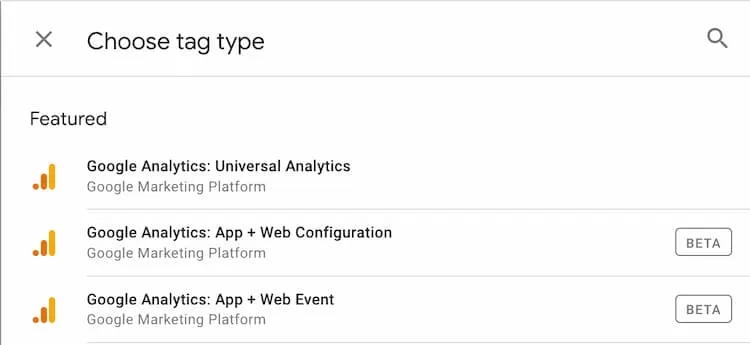
Select Google Analytics: Universal Analytics
Then, select Track Type as Pageview, located in the Google Analytics Settings section, and choose the variable created in step 4.
Below, in the Triggering section, click on All Pages, name the tag and save it. After clicking Save Tag, select Submit. Another dialog box will appear, simply click on Publish > Continue. Now, you have completed the entire GA4 setup process.
Comparison between GA4 and UA (Universal Analytics)
GA4 is an upgraded version of UA (Universal Analytics). However, it has changed in the way it collects event data and presents reports.
Compared to UA, GA4 focuses more on event analysis, and provides more detailed reports on the user’s journey and conversions.

Compare the difference between GA4 and UA
Differences between GA4 and UA are:
Measurement Model
UA uses sections while GA4 uses events to measure data such as pageviews, events, and transactions. Therefore, GA4 provides more detailed user behavior and easier reporting than UA.
Reporting
According to user behavior studies:
- Users have to pass through multiple touchpoints before making a purchase.
- On average, an adult uses 1-3 devices to access websites and apps.
- They may search for information from one device but may make a purchase from another device.
- Multichannel shoppers are usually valued three times more than single-channel shoppers.
And UA does not report on this multichannel shopping journey of users. Instead, GA4 excels in identifying which users use which devices.
GA4 applied Google Signal to merge data from both the website and app. At the same time, it uses a new algorithm to identify user sets.
Conversion (Goal)
Creating a conversion goal in UA takes longer than in GA4.

Creating conversion goals in GA4 is faster than in UA
Below are the step-by-step details of creating Conversions of these two versions.
Creating a Conversion (Goal) in UA:
- Step 1: Set up an event using Google Tag Manager or analytics.js, gtag.js, with data appearing in the event report.
- Step 2: Go to Admin > View > Goals and click “New Goal” to create a new goal.
- Step 3: Set up the goal.
Creating a Conversion (Goal) in GA4:
- Step 1: Similar to UA, you also set up an event using analytics.js, gtag.js, or GTM.
- Step 2: Turn on “Mark as conversion” to mark that event as a conversion goal.
Custom Dimension and Custom Metric
You can differentiate between these two based on the table below:
| Item | UA | GA4 |
| Number of Custom Dimensions | 20 | 50 |
| Number of Custom Metrics | 20 | 50 |
| Scope | – Custom Dimension: Hit, User, Session, Product – Custom Metric: Hit, Product | – Custom Dimension: Event, User – Custom Metric: Event |
| Configuration | – Custom dimensions and metrics are provided with an identifier code (index) when created. It is used in GTM tag configuration to push data to UA. | – GA4 will require entering an event parameter. They are also configured on GTM tags to push data to GA4. |
Data Retention
To set the time GA stores data, use the “User and event data retention” feature before it is automatically deleted.
Usually, UA has 5 time options, including 14, 26, 38, 50 months, and unlimited time. Whereas, GA4 only has 2 time options, which are 2 and 14 months.
Tracking Code
The tracking ID in UA is UA- (e.g., UA-123242129-6). While in GA4, the measurement ID starts with G- (e.g., G-LAKSFFA421).
Analysis Reports
The reporting feature of UA only allows Analytics 360 accounts to view and analyze data. Whereas, GA4’s advanced analysis capability helps admins get data on the user’s journey on both the app and the web.
BigQuery
In UA, the BigQuery feature only applies to 360 customers, but in GA4, it applies to all. You will have 10GB free per month to use SQL to query data as needed. This makes it easier to analyze higher-level data. As a result, you can better understand user behavior and improve your website effectively.
Interface
The interface in all reports of UA and GA4 is different. GA4 has fewer reports than UA, such as Landing Page, Site Speed, Sale Performance, Frequency & Recent,…
View
You can create multiple views for the website (more than 1 web) or app (more than 1 app) with UA. However, in GA4, you only have an Account and Property without a View. This is because the combined stream of GA4’s websites and apps is created by creating a data stream.

More data can be viewed in the UA version
Although GA4 has new upgrades to provide more features, it is still in the updating process, with more changes in the future. Therefore, you can still use UA at this time. You can gradually learn and get familiar with GA4 to facilitate future access.
Frequently Asked Questions about Google Analytics
Can you share Google Analytics data with others?
Yes, you can. Go to the Admin menu, select the User Management menu in one of the three columns, Account, Property, or View. From here, you can add the email addresses of those who want to share Google Analytics data. You can choose the permissions you want to grant to each email.
How can you check Google Analytics for multiple websites?
To check Google Analytics for multiple websites, you have two options to save time and perform the system, such as:
- Go to the main screen of Google Analytics with all your website lists, and you will see an overview of the top statistics. It includes access sessions, average session duration, bounce rate, and conversion rate.
- Or you can also perform other solutions such as creating a dashboard, such as Cyfe with a cost of $19/month. You can create multiple dashboards from Cyfe with a variety of data options from Google Analytics, social media pages, keyword rankings, Moz statistics, etc.
Find out more: The most popular video search engines currently in operation.
Final thoughts
Above is a complete overview of the Google Analytics tool, helping you understand all the features of GA and use GA most effectively. We hope that you have learned what is a metric in Google Analytics as well as other key setup procedures.
Follow On Digitals for updates on useful Digital Marketing knowledge. Or contact us for quick advice on SEO, Digital Marketing services for businesses.
NEWEST POSTS
- Common Business Challenges in Vietnam For Foreign Investors and Solutions
- What is Search intent? The importance of Search Intent for SEO
- What is Link Baiting? A Complete Guide to Do it
- Best SEO Strategies: 10 steps to reach your target audience through search engines
- Consumer Confidence Index Vietnam: A Boost in The Thriving Market
Read more